
Ever get an expensive power bill and want to know what appliance was the culprit? Maybe you want to learn how much an appliance is costing you? In today’s article, I show how you can use the Zooz Z-Wave Plus Power Switch with Home Assistant, InfluxDB and Grafana to track and plot an appliance’s energy usage and cost. The result is an easy to digest Grafana dashboard you can use to track what time of day your appliances are consuming the most energy and how much it’s costing you!
I’m using Z-Wave in this article, but feel free to substitute for whatever protocol your Home Automation setup is using. As long as you can get energy measurements for an appliance into Home Assistant you should be good to go!
Data Flow and Tools
Let’s first break down how I accomplished this and the various tools involved. Every appliance needs a smart plug or switch to perform the actual energy measurement and send it to the Hub. In my case, I’m using the Zooz Z-Wave Plus Power Switch (ZEN15). I’ve previously reviewed it on this blog.
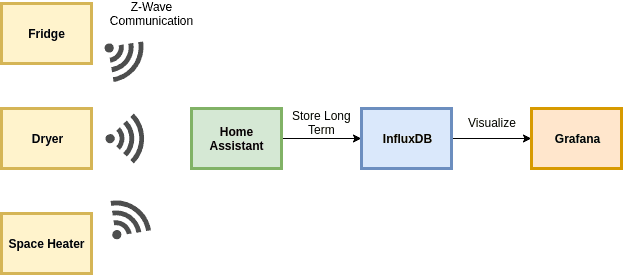
- All of the appliances use Z-Wave to communicate power readings (in Watts) to my Home Assistant installation. My Home Assistant uses the Aeotec Z-Stick Gen 5 as the Z-Wave Hub.
- Home Assistant aggregates that data from the appliances then sends it to InfluxDB to store in a database.
- Grafana reads the data from InfluxDB to visualize the measurements and perform calculations.
Refer back to my articles on Storing Home Assistant Sensor Data in InfluxDB and Visualizing Data using Grafana to setup InfluxDB and Grafana respectively with Home Assistant.
Creating the Dashboard
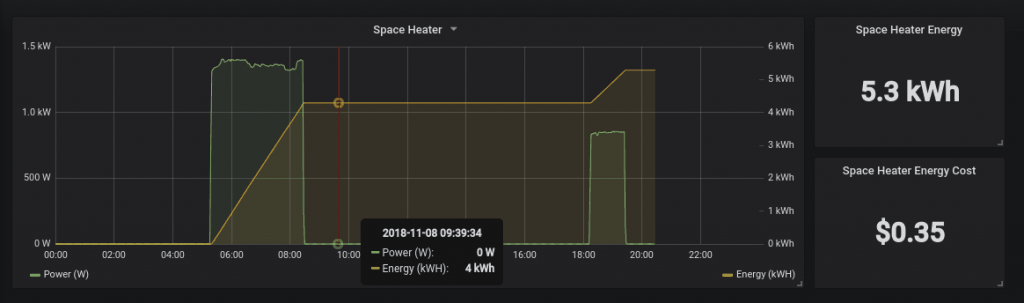
Once your data is in InfluxDB via Home Assistant you can use Grafana to create a dashboard to easily monitor the appliance. For my setup, I first created a graph showing the power usage at any given time as well as the energy consumption so far in the time period. Remembering back to high school physics class, power is the rate of producing or consuming energy and is typically measured in Watts. Energy is usually displayed in kilowatt hours and is what your electric company charges you by. My final dashboard is below for my space heater. The green line shows when it’s consuming power and the yellow line shows the total energy consumption in the time period.
Creating the Graph
For our display, we can show the power usage and use the Grafana math functions to calculate energy consumption during whatever time period Grafana is displaying. See my screenshot below for the settings for power and energy.
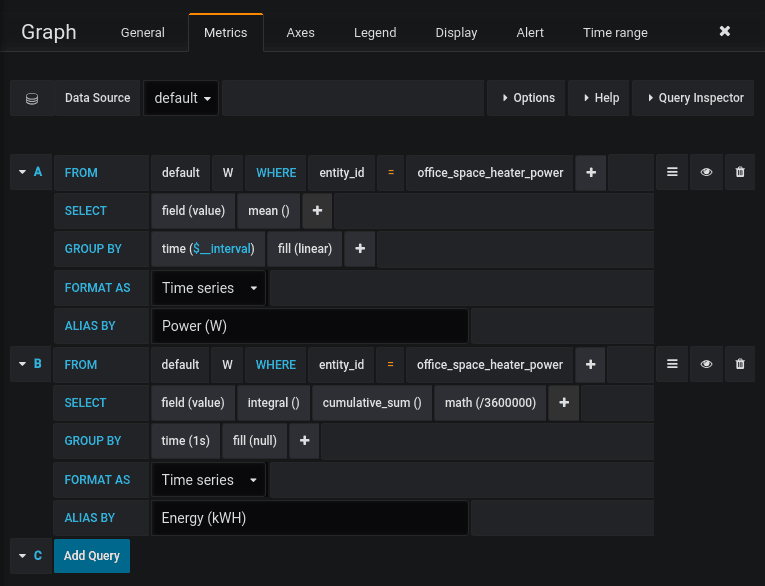
The power plot is basically just plotting the power readings from the smart switch and doing a linear fill.
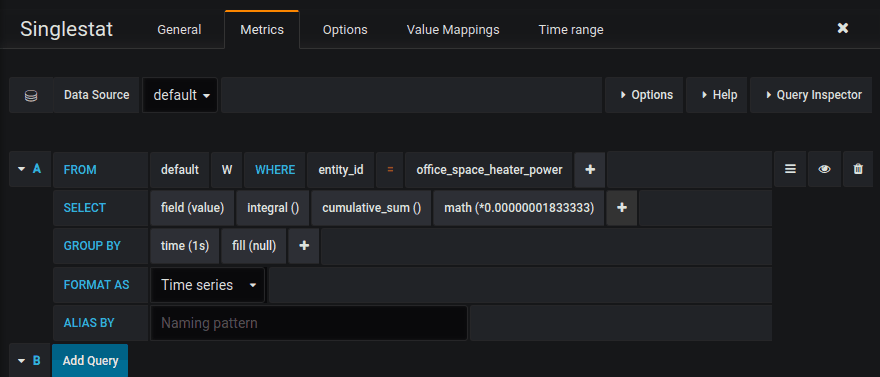
The energy plot is a bit more interesting. We still select the power reading related to the entity we are interested in measuring. However, we make use of the integral() and cumulative_sum() math functions in the SELECT field to integrate the power readings over the time interval. Those are then added together using cumulative_sum() to keep the running some over the time period. Finally, we divide the value by 36000000. When we integrate we get the energy reading in Watt-seconds. But, in the real world, we usually talk about energy in Kilowatt hours. So the value gets divided by 3600 (seconds in an hour) and divided by 1000 (Watts in a Kilowatt) to get it into Kilowatt hours. One other thing to note is the GROUP BY interval should be 1 second. This makes the division problem easier.
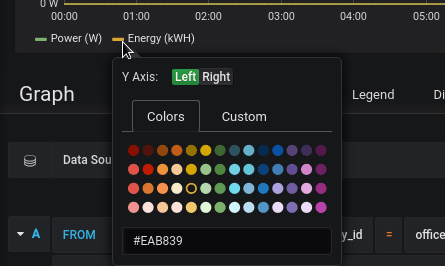
To make the graph easier to read you can make the energy readings show up on the right Y-Axis by clicking the graph’s legend and switching the axis.
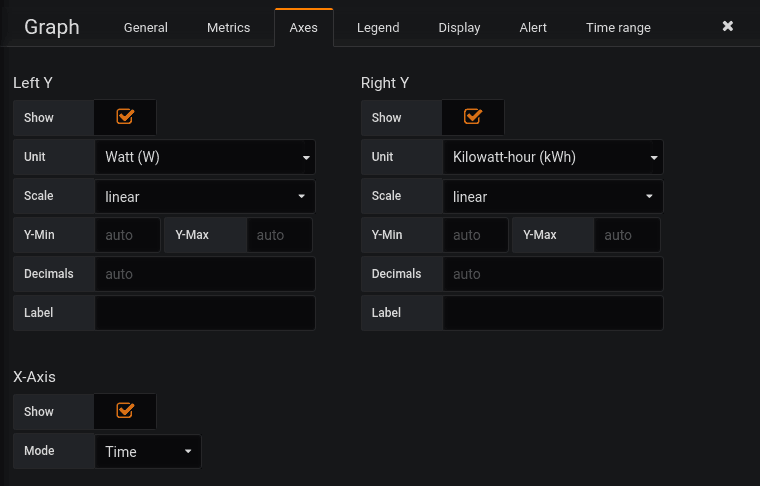
Finally, the axis tab has some nice settings to set units for the different axis.
Creating Singlestat Panels
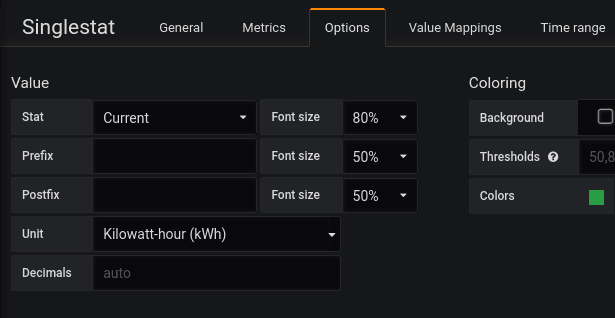
Grafana also supports “singlestat” panels, which simply just display a single stat. The first one I created was just the current energy measurement for the time slice selected. The metrics query is exactly the same as the one used for the graph. However, you want to change the options to choose the “Current” value.
Finally, the last panel I created calculates the cost for the appliance. You can calculate this by multiplying the energy measurement in kWh and the price your electric company charges you. I’m in Texas (which is on the low side for electricity prices thankfully) and get charged 0.066 $/kWh or 6.6 cents/kWh. I’m using Evergreen Power Solutions if you’re also in the area.
So far we’ve been calculating the energy, so we just need to multiply it by the $/kWh rate to get the cost. Remember before how we divided by 3600000? Dividing by 3600000 is essentially the same as multiplying by 0.0000002777. So for my scenario, we need to also multiply by 0.066 (my energy price in $/kWh). Therefore, we can just multiply the measurement by 0.000000018333. Which is just the conversion rate to kWh (0.0000002777) multiplied by the energy price (0.066).
As you can see in the above, only the math function changes in order to calculate the cost. Hopefully, I didn’t lose you on the math, it’s simpler than it may seem at first. Just may need to reread the last paragraph a couple of times!
Summary
I hope you found this energy calculation and Grafana tutorial useful. I can’t wait to add more appliances to my setup to have a full dashboard of energy measurements and more data on what’s hitting my energy bill. Grafana is a super powerful tool that can make some awesome visualizations once we have the data in a database.
Remember to subscribe to Self Hosted Home or follow me on social media to get notified about the latest articles! Leave a comment if you’ve got other uses for power measurement!