
Continuing off of my post from last week creating a WiFi Connected RGB LED Strip, I’m adding a new effect: music visualization. The goals of the project are:
- LED strip syncs to the music playing
- The audio comes in from a headphone jack
- LED strip should still be able to support a solid color and other visualizations
- Controllable over WiFi and using Home Assistant
- The LEDs add a subtle visualization to the music, don’t want my living room becoming a rave
- Everything should be hidden well for a high spouse approval factor
Hardware
To get started, check out last weeks blog post on creating the WiFi Connected RGB LED Strip. From that, we’ll be adding a little sound processing to our circuit. To do so, we can an Audio Analyzer chip. This chip will be responsible for reading an audio signal from a headphone jack and breaking it into seven frequency bands (63Hz, 160Hz, 400Hz, 1kHz, 2.5kHz, 6.25kHz, and 16kHz). Our software reads the levels for each band and creates visualizations. One visualization I developed looks at the bass of the song and changes the brightness of the LEDs to match the bass levels, effectively following the beat of the song.
Audio Splitting
For my implementation, I mounted the LEDs to the back of my TV. My TV just has a digital optical out for audio which I’m already routing to my soundbar. Therefore, I needed to get an optical out splitter and then convert that signal to an analog signal using a DAC that our circuit can understand. If you’re wanting to use a computer or phone as the music source, you can probably just use a stereo splitter to accomplish the same thing. One other piece of hardware you’ll need is a headphone jack you can mount to a protoboard for the design.
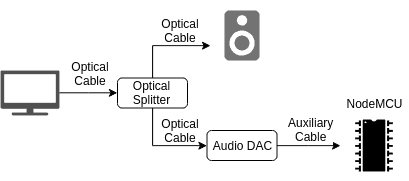
Here’s the hardware I used for splitting the audio and getting it to the NodeMCU:
| Item | Comments |
|---|---|
| Optical Splitter | Splitter to split the optical audio output on my TV to my speakers and LED strip |
| Audio DAC | Convert optical audio into analog signal for processing |
Audio Processing
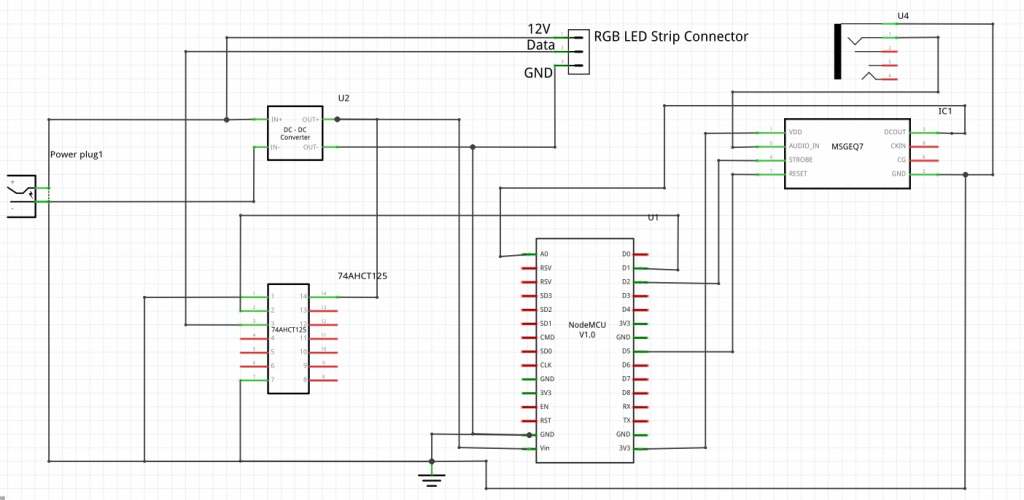
Once you have an analog audio input you can connect it to the headphone jack in the circuit. If you look at the circuit diagram below, the headphone jack is routed into the MSGEQ7 audio analyzer chip that is then connected to the ESP8266 which ultimately controls the WS2811 LEDs. Check the full schematic below, while it may seem daunting at first it will make more sense the more time you look at it. The left side of the schematic takes care of getting the correct voltages we need (12V and 5V). The NodeMCU is connected to a logic level converter to communicate with the LED strips at 5V. The right side of the schematic converts the analog audio signal into the digital signal the microcontroller can understand.
I’ve talked more about the LED strip hardware setup in last weeks post when creating the WiFi Connected RGB LEDs. Here’s the full hardware I used for reading the audio signal and controlling the LEDs.
| Item | Comments |
|---|---|
| LED Strip | The LED Strip! |
| Power Supply (72W) | LED Power Supply - 72W |
| LED Power Supply (360W) | LED Power Supply - 360W |
| DC/DC Converter 12V to 5V | DC/DC Converter to power NodeMCU from LED Power Supply |
| NodeMCU | The WiFi programmable microcontroller we can use to control the lights |
| Audio Analyzer Chip | Chip to read the audio signal and communicate with the NodeMCU on the frequencies used |
| Logic Level Converter | Logic Level Converter to convert the 3.3V data signal coming out of the NodeMCU to 5V for the LED strip |
| LED Connector Cable | Nice cables for connecting LED strips |
| LED Channel Diffuser | Can be useful to diffuse LED lights |
| Power Jacks | Power Jack to connect power supply to protoboard |
| Protoboard | Protoboard for mounting electronics |
| Plastic Boxes | Plastic box to mount electronics. Could also 3D print this. |
Software
Thanks to the great MSGEQ7 library on GitHub the software is pretty easy! You can find all my code on GitHub for this project as well. The LED strip can be completely controlled via Home Assistant over MQTT so you can set up automations for changing the light strip automatically. Or you can manually control the lights through your smartphone using the Home Assistant user interface. This approach should work for other smart home platforms that support RGB lights over MQTT.
Following up from the previous article, I’ve added a few more visualizations specifically for syncing up the LEDs to the music. There are two main visualizations I added that I’ll briefly explain the code.
RGB Full Spectrum Visualization
The MSGEQ7 breaks the audio signal coming in into 7 different frequency bands for low, mid and high frequencies. The first visualization I developed assigns Red, Green, and Blue to those different frequencies and sets the entire RGB strip to that color.
|
1 2 3 4 5 6 7 8 9 10 11 12 13 14 15 |
void musicRGB() { bool newReading = MSGEQ7.read(MSGEQ7_INTERVAL); if (newReading) { uint8_t freq1 = MSGEQ7.get(MSGEQ7_1, 0); uint8_t freq3 = MSGEQ7.get(MSGEQ7_3, 0); uint8_t freq5 = MSGEQ7.get(MSGEQ7_5, 0); freq1 = mapNoise(freq1); freq3 = mapNoise(freq3); freq5 = mapNoise(freq5); fill_solid(leds, NUM_LEDS, CRGB(freq1, freq3, freq5)); } } |
I start off by getting a new reading from the MSGEQ7. If the reading is actually new, the software gets values for 3 of the frequency groups (1, 3, and 5). Next, we reduce the noise of the signal. Finally, the software fills in the whole LED strip with a new RGB color created from the amplitude at those three frequencies. I think this visualization does a great job showcasing the music playing because you can see the color change for every change in the song.
Here’s a demo of the visualization:
Rainbows Bass Visualization
Because the lowest frequencies of music (the bass) typically match the beat of the song, a cool visualization is just to sync up the brightness of the entire LED strip with the bass.
|
1 2 3 4 5 6 7 8 9 10 11 12 13 14 15 16 17 18 19 20 21 22 23 24 25 |
uint8_t getBassReading() { // Get values for lowest frequencies uint8_t freq0 = MSGEQ7.get(MSGEQ7_0, 0); uint8_t freq1 = MSGEQ7.get(MSGEQ7_1, 0); freq0 = mapNoise(freq0); freq1 = mapNoise(freq0); // Use whichever frequency is being used more freq0 = max(freq0, freq1); // Map the values so there is always at least 20 brightness freq0 = map(freq0, 0, 255, 20, 255); return freq0; } void musicRainbow() { bool newReading = MSGEQ7.read(MSGEQ7_INTERVAL); if (newReading) { uint8_t freq = getBassReading(); FastLED.setBrightness(freq); rainbow(); } } |
The musicRainbow() function starts by getting a new reading from the MSGEQ7. Next, if the reading is new, the program analyzes the reading and extracts the amplitude of the bass. The getBassReading() function looks at the lowest two frequency bins and returns the value for the most prominent bin. I found that most song’s beats fall into one of these two bins. Then, the bass reading is mapped so that it scales from 20-255 instead of 0-255. I found that going from 0-255 created a bit too much strobing for my liking, so keeping the strip on 20 brightness creates a less drastic effect. Finally, the brightness of the LED strip is set to the bass reading and the LED strip is filled in with a rainbow pattern.
Here’s a little demo of the visualization:
Parting Thoughts
I hope you go out and make your own LED strip with music visualization! This project is great for those getting started with LED strips and learning about audio processing. It adds a little flair to your living room when hosting parties but isn’t overly cheesy. If you have any great ideas about new visualizations or improvements to the design please comment below!
Please remember to sign up for my mailing list and follow me on social media for more new articles. Thanks for the support!