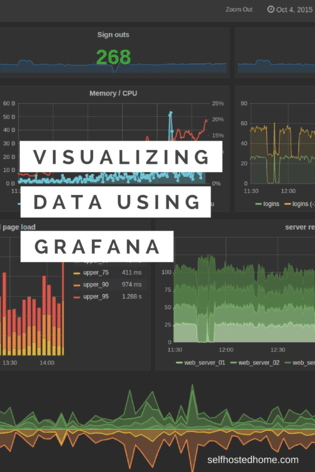
Visualizing Data using Grafana

Grafana is a really powerful tool used throughout the tech industry to visualize time series data. It’s open source software that allows you to create visual dashboards comprised of panels so that you can view and analyze your data. People frequently use it to monitor the health of their network and connected devices but in our setting, we can visualize any data we collect via Home Assistant.

Check out my last article on setting up InfluxDB to learn about a time series database and how to set one up.

[Read more…]

Storing Home Assistant Sensor Data in InfluxDB

How are you storing data collected in your Home Automation? Today’s article looks at a time series database called InfuxDB that Home Assistant can use to store all your sensor data in a database. Once the data is stored in the database you can analyze it for trends, create graphs and use the data in other applications. Ever feel restricted by the Home Assistant UI on how it shows data over a long time? InfluxDB is a tool to help you solve that!

[Read more…]